Onoken at a Glance
See below for a brief overview of Onoken's business
model, our strengths, and our operations in figures.
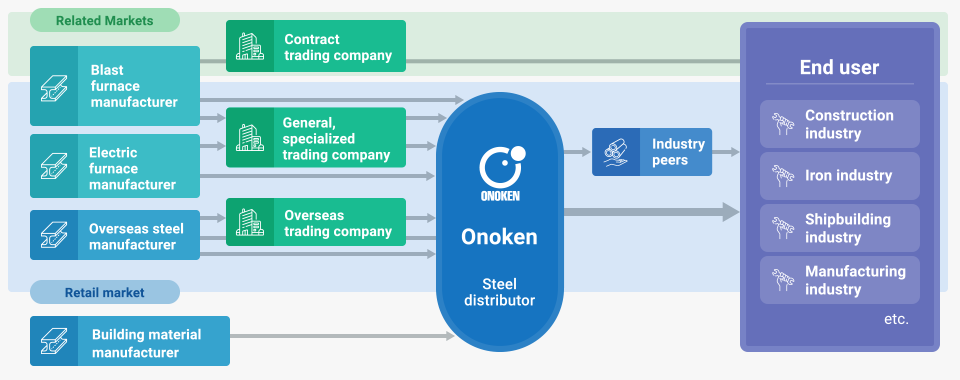
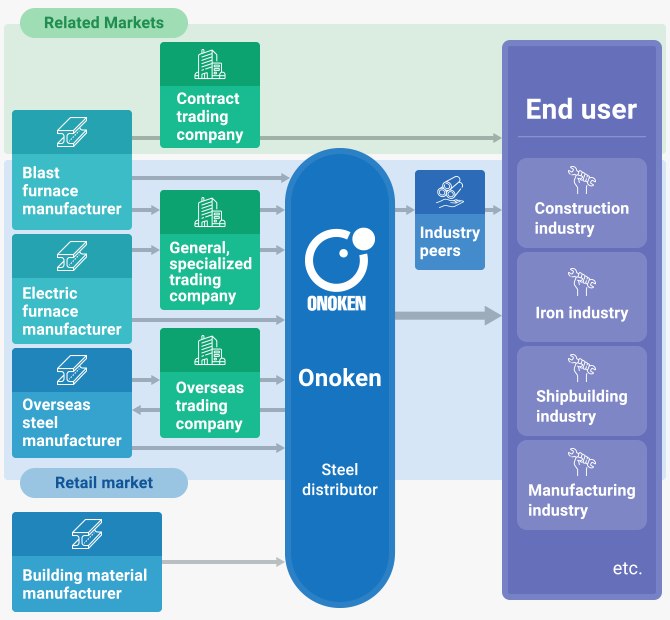
01What is Onoken?
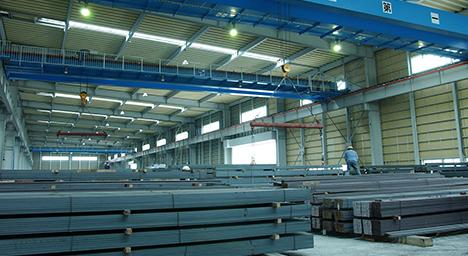
Onoken is a trading company specializing in steel as well as construction materials with a top share in the steel distribution industry.
Established in 1949 for selling cement, ironware, and construction materials, Onoken began full-scale sales of steel products around 1957 in response to rising demand. We have grown over the years as a trading company that is not afraid to go beyond industry convention, and we were the first in our field to import steel products into Japan. One of our greatest strengths is our ability to coordinate between manufacturers and customers by leveraging our nationwide network of distribution centers to deliver steel and construction materials throughout Japan in the shortest possible time.
02The Onoken Mission
Management Philosophy
Onoken's management
philosophy is to continue as
an indispensable entity for
customers and industry as
experts in steel and
construction materials.
We intend to be a company with a strong market presence by increasing our strengths and by continually providing services that benefit our customers, making us an indispensable entity.
We are unwavering in our goal to consistently take on new challenges and keep the customer first in our minds.
03Onoken Strengths
- Onoken has distribution centers throughout Japan and can handle just-in-time deliveries from a single piece of steel or a cut sheet.
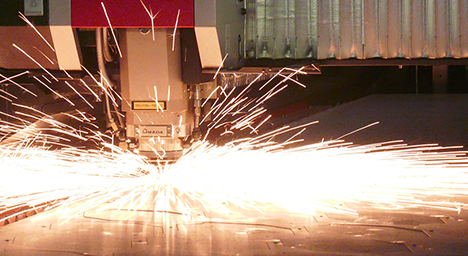
- Aside from selling steel as a raw material, we can also process and deliver steel based on specific requirements.
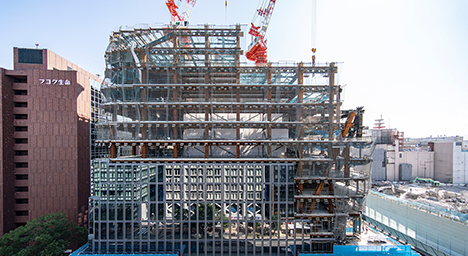
- In addition to steel, we handle construction materials and construction (building) contracts.
04Onoken in Figures
As of March 31, 2022
Net sales
(consolidated)
.
Ordinary profit
(consolidated)
.
Fiscal year ended March 2022
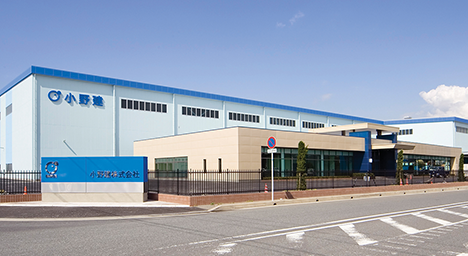
Bases
Employees
(consolidated)
(parent)
Customer
companies
,
Supplier
companies
,
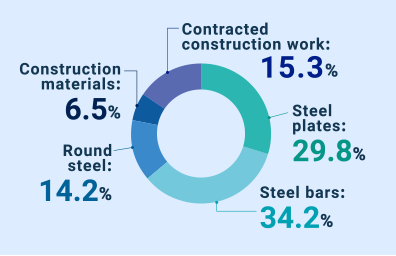
Sales
Breakdown